
 Hi, I am Gregor Hohpe, co-author of the book Enterprise Integration Patterns. I work on and write about asynchronous messaging systems, distributed architectures, and all sorts of enterprise
computing and architecture topics.
Hi, I am Gregor Hohpe, co-author of the book Enterprise Integration Patterns. I work on and write about asynchronous messaging systems, distributed architectures, and all sorts of enterprise
computing and architecture topics.
Find my posts on IT strategy, enterprise architecture, and digital transformation at ArchitectElevator.com.
At the 2005 Crested Butte workshop Erik Doernenburg and gave each other demos of our visualization work. After we managed to peek each other's interest we decided to create a Talk on Software Validation. We have delivered the talk a few times and have received great feedback. The talk is especially fun because it includes five live demos (and they usually work).
These demos also provided a reminder how useful it is to share your code with the community. At JavaZone in Oslo my hard drive crashed shortly before our talk and I was not able to run the demos off my machine. Luckily, my messaging toolkit is available for download, so I was able to quickly install the demo on Erik's machine. Setting up under time pressure also provided an excellent data point regarding the "out of box experience" with the toolkit.
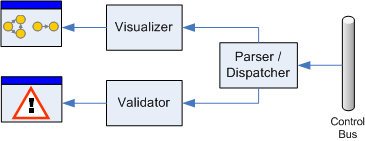
My section of the talk is based on my earlier work with Visualizing Dependencies. I instrumented a simple messaging library so that all publication and subscription information is sent to a Control Bus channel. A visualizer component listens on the control bus channel and converts the publication and subscription information into a graph, which it subsequently renders into a GIF image.
During our talk we mention an "advanced" technique that would not just render an image of the system model, but also examines the model and alerts the user about potential problems. It does so by applying known rules for "do's" and "don'ts" to the model. These rules could be as simple as "circles in your dependency graph are bad" or one of those sophisticated self-learning AI algorithms that we never quite understand. The only catch is that we actually never demo such a validation tool. Finally the time came for me to put my money where my mouth is and enhance the messaging toolkit to perform validations of the messaging system.
One of the key messages we are trying to highlight during our talk is the importance of mapping the captured data to a model that is suited to answering the questions you are interested in. This model can be a graph, a process or any other abstract representation of your system. Making a model is important for a number of reasons:
After I convinced myself that a model is a useful thing I set out to make one. My simple messaging toolkit allows users to compose solutions by connecting system components through message channels. The resulting system very much resembles a graph, where nodes represent the components and edges represent the message channels. This is the model I want to extract from a running messaging system.
I developed the model generation as an add-on to the existing visualizer. The visualizer listens on the Control Bus for messages announcing components sending messages to and receiving messages from certain channels. Instead of rendering a picture, the validator's role is to create a graph model and to analyze it.
Maybe I am biased but the first high-level architecture that came to mind for this task was a processing pipeline:
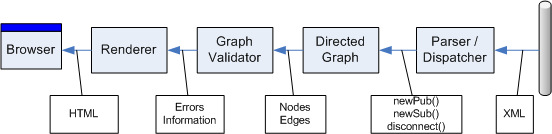
If Conway's law holds true in the reverse I must be 4-way schizophrenic. In all earnest I think this is one of the many cases where a "non-OO" top-level architecture works very well and can be nicely implemented using an OO language. The pipeline consists of 4 parts:
| Component | Purpose | Input | Output |
| Parser | Parse XML messages from the control bus into a strongly typed format | XML | Events |
| Graph Generator | Construct a graph from the control bus data | Events | Graph Nodes & Edges |
| Validation | Run algorithms over the graph | Graph Nodes & Edges | List of error and informational messages |
| Renderer | Display results to the user | List of messages | HMTL page |
The most interesting parts of the chain are the Graph and the Validation. The Parser and Renderer are nothing more than adapters from the core algorithms into the outside world. The primary contribution of these components is to keep the core algorithm free of XML and HTML cruft.
Let's take a closer look at the second step in the pipeline – the graph generator.
The generator receives events from the Control Bus, informing us of components publishing
or subscribing to channels. Constructing a graph based on these events consists primarily
of matching publishers and subscribers using the same channel. I have to apologize
for not migrating the messaging toolkit to .Net 2.0, so this code does not use generics.
I am still in shock, though, to discover that .Net collections do not provide a Set
class! Luckily, I am not the first one noticing this oversight, so I pulled one off
Code Project (since then I discovered C5 and PowerCollections). Overlooking these little handicaps, the solution is fairly straightforward. The
component converts a set of subscriptions and publications into a set of nodes and
edges. The method works off publications and subscriptions dictionaries that map from a channel name to a list of publishing and subscribing
components, respectively. The good news is that this is a demo application and not
a Google job interview so we don't have to come up with a O(1) algorithm but simple nested loops will do. The real trick here is to define Node
and Edge as value objects. This makes it easy to just new up nodes and edges at will
and add them to a set. The value-based equality of these objects ensures that the
sets hold at most one instance of each node or edge object.
void BuildEdges(IDictionary publications, IDictionary subscriptions)
 {
   foreach (string channel in publications.Keys)
   {
     if (subscriptions.Contains(channel))
     {
       foreach (string pub in (IList) publications[channel])
         {
           foreach (string sub in (IList) subscriptions[channel])
           {
             AddEdge(channel, new Node(pub), new Node(sub));
           }
         }
       }
     }
   }
Because not all nodes are actually connected to other nodes we need to make sure that all nodes are represented in the graph, even if they are isolated.
void BuildNodes(IDictionary publications, IDictionary subscriptions)
{
  foreach (string channel in subscriptions.Keys)
  {
    foreach (string subscriber in (ArrayList) subscriptions[channel])
    {
      nodes.Add(new Node(subscriber));
    }
  }
  foreach (string channel in publications.Keys)
  {
    foreach (string publisher in (ArrayList) publications[channel])
    {
      nodes.Add(new Node(publisher));
    }
  }
}
This approach is a bit brute force but plenty good for a demo application. Again, the set collection ensures that each node and edge is only stored once in the graph.
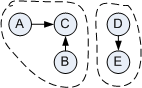
Nice separation of concerns enables us to generate a graph that has very little to do with message channels or publications. This makes it easy to run standard graph algorithms against our system model. For example, we can easily determine whether the graph is fully connected, i.e. whether all nodes are connected through edges. Depending on the messaging solution a disconnected graph is not necessarily an error condition, but it provides a useful status check. For example, if we are building a single message pipeline and we find that the graph is not connected, something must have gone wrong, maybe because a component shut down or a channel was misnamed.
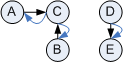
To assess the connectedness of a graph, the direction of the edges is not relevant. Therefore, for each existing edge we add a reverse edge between the same nodes (see figure). Now can just pick any node and from there recursively traverse all neighboring nodes. Once we are done, we can check whether we visited all nodes in the graph. If so, the graph is connected, otherwise it consists of multiple "islands".
Another useful property of the directed message graph is the presence of circles. Again, circles are not a show stopper but they can be an indicator of a solution that is request-reply heavy as opposed to a pipes-and-filters message flow.
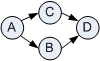
A simple depth-first-search (DFS) can easily find circles in a graph. If you hit a node you already visited, the graph contains a circle. Finding circles in a directed graph is not quite so trivial. When the search hits a node that was already visited, the algorithm has to distinguish between upward edges and sideways edges. This ensures that a "diamond pattern" is not reported as a circle. For example, DFS over the following graph hits node D twice, but the graph does not contain a circle.
This took me a bit of work to get it to work correctly. Maybe this is a sign that Google should not have hired me—they love to ask these kinds of algorithm questions in job interviews ;-P Once again mapping the messaging into a generic graph paid off because it made creating unit test cases very easy:
public void GraphWithDiamondButNoCircles()
{
  graph.AddEdge("AB")
       .AddEdge("AC")
       .AddEdge("BD")
       .AddEdge("CD");

  Assert.IsFalse(new CircleFinder(graph).HasCircles());
}
They to making these tests so simple is a little helper class that makes string assumptions
(e.g. nodes have only single letter names) and allows method chaining by returning
this.
class SimpleGraph : DirectedGraph
{
  internal SimpleGraph AddEdge(String edgeString)
  {
    if (edgeString.Length != 2)
    {
      throw new ArgumentException("test edge string has to have two characters");
    }
    Node source = new Node(edgeString.Substring(0, 1));
    Node dest = new Node(edgeString.Substring(1, 1));
    AddEdge(edgeString, source, dest);
    return this;
  }
}
You can do cool things with graphs, but there is another interesting validation you can perform before you build the graph. The graph model assumes senders and receivers are connected via channel. But what if a component sends messages to a channel that no one listens to? Such a "loose end" would certainly seem suspicious.
Once again I access the publications and subscriptions dictionaries that map from a channel name to a list of publishing and subscribing
components. Finding publishers that have no one to talk to is as simple as this:
IList PublishersWithoutSubscribers()
{
  IList result = new ArrayList();
  foreach (string queue in tracker.Publications.Keys)
  {
    if (!tracker.Subscriptions.Contains(queue) || ((ICollection)tracker.Subscriptions[queue]).Count == 0)
    {
      foreach (string component in (ICollection)tracker.Publications[queue])
      result.Add(new EndPoint(component, queue));
    }
  }
  return result;
}
This code finds channels that have no subscribers and adds all publishers to such a channel to the list. Note that we left the formatting of the error message to the output component.
The existing Visualizer component already tracked messages for the purpose of graph rendering. We can now hook the Validator into the same infrastructure.
This is where delegates make it very easy to hook in additional algorithms to the original parser.
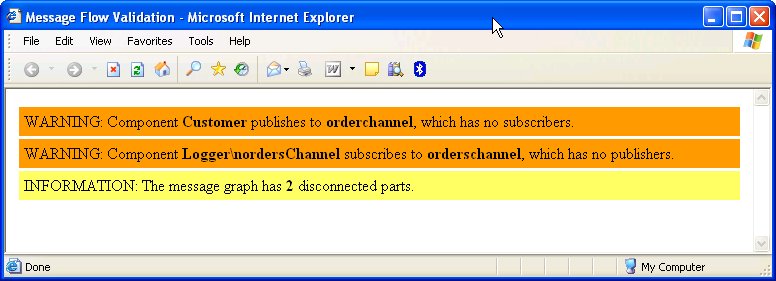
Now that we encapsulated all the business logic rendering the messages is trivial. First, we need to decide which messages are warnings and which ones are just informational. Lastly, we need to render into a suitable output format. Once again creating an HTML file with a META-REFRESH tag in the header proved to be more than sufficient. This causes the browser to reload the file every few seconds or so, giving us "real-time" display of warning messages:
You could think of many more validations. For example, one could check whether all competing consumers on a single queue are of the same type. Different kinds of consumers competing for the same type of message is probably suspicious.
The updated messaging kit is available for download. Starting the Visualizer (see instructions) by default generates two HTML files:
graph.html and validation.html. graph.html shows the rendered GIF image of the message graph while validation.html displays warnings and informational messages. To test the system, simply start the
Visualizer and a logger to an unused channel: logger someChannel. The validation.html contains a message:
WARNING: Component Logger\nsomeChannel subscribes to somechannel, which has no publishers.


 Gregor is a cloud architect and author. He is a frequent speaker on asynchronous messaging,
IT strategy, and cloud.
Gregor is a cloud architect and author. He is a frequent speaker on asynchronous messaging,
IT strategy, and cloud.